Showing posts with label Hedge Funds. Show all posts

Saturday, April 2, 2011

Being Made Whole in Bankruptcy

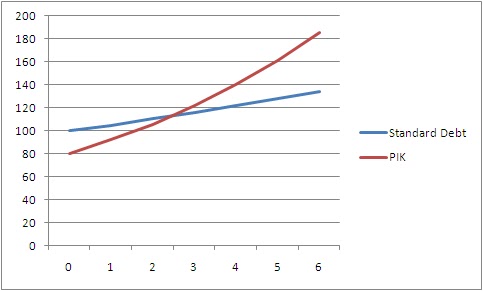
In our discussions in our Managing Corporate Turnarounds class during our financial restructuring session, I got to thinking about what it would take to be made whole in a bankruptcy scenario. While the hard math will tell you that it is impossible in the short term (EV = 80, Net Debt = 100), I began to think back to the PIK and using a high yield to restore value in the future. So my question became this: If I hold the debt of an insolvent company, what can I negotiate to help me restore value? The most obvious solution is to renegotiate the terms of my debt which will probably result in me taking a haircut (discount) on the principal or face value of my debt. However, we’ve acknowledged that in scenarios where people become riskier, obviously the company’s related securities should bear a higher return. So my question then evolved to: If I have to take a discount of X percent, what additional spread Y would I have to earn in order to be made whole in N years. It turns out:

FV x (1 + kd) ^ N = FV x (1 – X) x (1 + kd + Y) ^ N


However, this assumes that you can break even with (or more accurately, catch up to) where your security would have been if the company had not defaulted to begin with. After playing with these numbers, however, it was quite clear that even with a small discount (say 20% discount), the spread Y had to be astronomically (unreasonably) higher in order to have any chance of being made whole relative to the standard debt, so I thought it would be unrealistic not to include a factor which accounts for the value lost:

FV x (1 + kd) ^ N = FV x (1 – X) x (1 + kd + Y) ^ N + Value Lost


In trying to understand what these numbers mean, I looked at Value Lost / FV as a proxy for the default rate of this type of security in distress which is obviously closely tied to the actual economic circumstances of the company. In the graph, it is reflected by the distance between the Standard Debt curve and the PIK (Realistic) curve.

Also, Y can probably be determined by looking at the spread between similar bonds with different credit ratings (dropping from BBB to C for instance).

X is reflective of the economic scenario (so if EV was 80 and Net Debt was 100, X would be 20%). It is also reflective of the negotiations, as well as considering a discount in order to liquidate the current assets of the company.

Another problem is also that once a company switches from PIK to cash sweep, its risk profile drops and it stops earning high yields, dropping the return on capital and therefore making it impossible to “catch up”. Also, a bank which was happy to finance your debt will not be interested in converting neither into a mezzanine structure better suited for hedge funds nor into equity.

This model is similar to the VC model of predicting the failure rate using the discount rate except in reverse. It is also similar to the interest rate parity (IRP) model and boot strapping by using compounding to determine where you would have / should have been otherwise as a benchmark for where you are going.

I guess the real lesson is that bankruptcy is really expensive and that being made whole in this scenario is difficult, regardless of the financial engineering and patience, although these two factors can be used to ease the pain.

Thursday, February 10, 2011

Bid / Ask Curves

At the break in behavioural finance, I was speaking to a prop trader about the mechanics of the market. This reminded me of my short trading exercise in the Rotman Finance Lab with the Trading Simulation software.

In microeconomics, we discuss demand curves and how they are based on individuals with different levels of willingness to pay. So as the price increases due to a supply curve shift right (less supply), the quantity demanded decreases.

In markets, this is a little more transparent if you look at the bid / ask lists. These lists show the prices and volumes people are willing to buy and sell for. The other unique thing about the capital markets, is that there is actually a set number of securities (assuming that banks do not issue or buyback securities in the short term, supply is price inelastic based on total float) and that investors can be both buyers and sellers (short term suppliers and consumers) of securities. Actually, a better way to put it would be they can either hold or release securities (demand based relationship).

If their intrinsic value (IV) of a stock is above the current market price, they will buy the stock. If their IV is less than market, then they will sell. And in an exchange market, that is exactly the case (orders, unless removed before execution, are commitments to buy or sell at the stated price).

Shown here is an illustration of a “complete” market. This assumes that everyone’s IVs are included, that there are no hidden orders and that people’s opinions won’t change with the market price (a snapshot by nature). The current ask price is $8.00 and the bid is $7.75. As people’s sentiments change (or new investors are introduced into the market), orders to buy are satisfied at $8.00 and orders to sell are satisfied at $7.75. If all the potential sellers at $8.00 are taken up, then people can only buy the stock at $8.25 and the stock price goes up. Note that the differential between bid and ask is a proxy for market liquidity, as the lower the transaction fee to enter and exit a position the lower the cost of trading the security.

Also note that the steepness of the curve is a good proxy for potential volatility as well. Because if the slope of the curve is steep over a variety of prices, it means that the market doesn’t necessarily agree on the price. And if a few people cross the line from one side to another, the price can change quickly and dramatically (shown below):

Monday, August 2, 2010

Flight of Fancy: What If...? A Market for Bid Points

One common theme I've heard is that MBA's are often upset when they don't get all the elective courses that they want. While I certainly can't complain, it brings up an interesting question: "What if someone like me was able to sell their bid points? What would I get for them? And how would you value them?"

For example, my course choices weren’t very restrictive, I got 500 points to bid on four courses, most of which I could have gotten with a zero bid. Whereas, Mr(s). Ambitious was trying to take TMP and Value Investing while going on Exchange (physically impossible, Value Investing is a year long course and Exchange means you are physically gone). If there existed a mechanism (and therefore a market) for me to transfer my points for a price, what would I get for them? What should they be worth? Clearly, there is currently some "market inefficiency" as we are both unsatisfied: Mr(s). Ambitious because they didn't get all the courses they wanted [net deficiency] and me because I didn't realize the full value of my bid points because I had more than I could use - [net surplus].

Well let’s make some assumptions:

  • Rotman tuition is C$35k per year (let’s not include first year as it’s common, or you can adjust the value of points accordingly if you feel second year courses are more / less important)
  • You take 10 elective courses in your second year
  • You are given 1000 points with which to bid

A “book value” of the points would simply be C$35k / 1000 points or about $35 per point.

But keep in mind that when something is inherently useful, especially in a scenario where a few points margin can mean the difference between getting the course you really want versus having to settle for a less popular course, there can potentially be bidding wars from “oversubscription” (points trade at a multiple above their book value) especially if they were in limited supply.

While people are paying C$70+k to go to school, for a marginal $35 x 100 points (a rough approximation of the average points allocated per student / course) or $3500 you can get any course you want (including the highly coveted TMP and Value Investing – which includes a trip to visit Warren Buffet – one of the reasons why this course is so wildly popular).

If you could some how do it, you could see how much additional probability you have of getting into the classes you wanted and put a dollar value on how badly you wanted to be in that class (regression analysis), you can determine a price you’d be willing to pay to attend that class. For example: Would there be a correlation between the number of points you consumed to get into classes of your choice against your overall earning power once out of university (thinking along the lines of DCF to value bid points like common shares).

And also imagine if this market had a “market maker”. For example, the PSO will (create and) sell you points for a certain value (either regulated and pre-determined or floating with the market). Students could liquidate their points at market value and get money back or buy points of the market to be more competitive for course selection and the school could potentially get revenue from selling points.

And since you have a market with underlying assets, imagine if you created financial instruments for those assets (shorts, puts, and calls for bid points, futures).

And imagine if other schools had market systems (I’m told that bidding systems are not uncommon at other MBA schools), you could trade between these. Or even other programs!

Of course, these points would inherently have an “expiry” as to their value (you wouldn’t want to be holding (take delivery of) 5000 MIT Engineering points if you were going to Stanford Law School).

There are some interesting implications. For instance, a new ranking system for schools where the relative value of a course is determined by the market value (determined by students taking courses there) in real time with comparisons to year over year values. Example: Would an engineering calculus class go for more at Waterloo or Toronto? Could you couple this with flexibility between schools (accreditation programs) which allow students to take equivalent courses at other schools and what do you get?

It would be a more sophisticated and real-time version of tuition regulated by the market. Taken to the extreme, here is another idea: drop the original tuition completely and have students buy bid points for classes. And then what if you were able to connect this market to actual financial markets? An S&P Index of Undergraduate studies to benchmark the valuation of your individual class’ performance.

Another thought: If the value of courses in a particular faculty started to "overheat" would that be a leading indicator of oversupply of labour in a particular industry in 4 years time?

Thursday, April 22, 2010

Valuing Commodities Companies - Looking at P/NAV

Recently, I've been trying to learn more about commodities companies building on what we've learned in class as well as discussions with colleagues. Especially as Canada is a strong resource based economy (with a currency heavily influenced by the price of oil, I'm told), it is important to understand how these companies are valued.

Shree was previously very kind to explain why commodities companies provide leveraged exposure to the underlying commodity. In fact, I'm told that this is the reason why companies trade a P/NAV multiples greater than 1.

When I inquired as to what exactly Net Asset Value (NAV) was composed of, I was told that it is essentially the Asset Value (value of the commodity "in the ground") netted by the cost it took to get that asset out of the ground. So if you had to take a snap shot of what that company was worth, you'd intuitively assume that the value of the company was it's NAV.

However, as Shree demonstrated, the markets are always moving and the price of the commodity which the company bases its value on will change. This produces option like behaviour in the price of the company. While not a perfect explaination, I was told to think of it this way:

The value of the company is related to it's NAV PLUS a premium associated with the volatility of the commodity and the probability that the price of that commodity will increase. This is analogous to Intrinsic Value (NAV) + Time Value of a call option.

Obviously, there are a host of complicated relationships related to volatility, future price expectations, supply and demand, hedging and speculation which make this basic generalization a little too simple. However, I think it serves as a good starting point for how to think about and model the price.

This is similar to what we learned in Finance II when our professor explained the example of land that contained 1M barrles of oil which could be extracted at a price of $70 per barrel when the market price of oil was $60 per barrel. While a naive NPV calculation at today's rates would imply a negative NPV, the potential for the price of oil to top $70 provides real value to the land.

Monday, March 22, 2010

Getting a Job in Asset Management

Previously, I was asked to write a post about getting a job in the Asset Management industry. While I myself am not that well versed on the buy side, I interviewed and got advice from other people who know more than I and were successful in getting interviews / offers. This is of course, beyond what is expected in any capital markets job, and this is what they had to say:

Application Materials

As always, you have to get your initial application materials in order with the hope of getting that first round interview. At the application stage, asset management companies have been known to ask for typical materials such as resume, cover letter and transcript as well as:

  • Writing samples
  • Sample stock pitches

Networking

As always networking is an important part of getting that first interview. Before you start networking, you should already be very polished, particularly on the topics of:

  • Their fund strategy and your style / fit
  • Know their holdings and weightings
  • Diversification - know the focus of the fund

To get this information:

  • Hedge funds tend to be proprietary and it will be more challenging to get info
  • Mutual funds holdings are generally public

Either way, go go onto Capital IQ / Bloomberg and find out as much as possible. Read manager's letter about their performance and strategy. Know their best performing success stories as well as their dog holdings. Know where their exposures are and what strategies they are using.

If you impress them at the outset with a networking or informational interview, that improves your chances of getting that first round interview.

Interview

For the interview, they will probably ask you a few fit questions. I've been told buyside will not ask you too much technical stuff on valuation (i.e. walk me through a DCF) because these are expected. If your resume doesn't show some experience in capital markets, I'm told you have a much lower chance of being interviewed.

Have a view of the market and ensure congruency in your view. A great piece of advice was to really understand the "off balance sheet items". The reasoning for this is because these are the items that are more difficult to value and provide you a potential differentiation advantage. If you are able to better interpret this information, this is your potential competitive advantage in the market.

Also, the "stock pitch" component of this interview is generally more intense than in other finance jobs. I've heard it described as the interview was just "10 stock pitches". Having said that, while most finance interviews usually require 2 longs and a short, it's been suggested that you have a mix of 10 long and short positions, with a mix of long and short companies and industries. Also, you have to make sure that there is congruency in your view as well as your story.

For instance, one example from an interview was: "I see that you've recommended this stock because you think the industry is strong. If that is true, why not buy an ETF of that industry rather than cherry pick stocks? What if the one or two companies you buy in that industry turn out to be dogs?"

Asset management is much more than just "buying and selling stocks" as any portfolio manager will tell you. There are many aspects that portfolio managers are responsible for in funds including:

  • Risk Management and protection or hedging strategies
  • Investment style
  • Investment objectives and goals
  • Liquidity requirements

It is important to comprehensively understand and prepare as much as possible so that you can maximize your chances of getting a successful result in your interviews.

Saturday, February 20, 2010

Equity Near Bankruptcy (or NPV = 0) Behaving as Call Options

This might be one of the most brilliant finance things I've ever seen taught a few days ago by our finance prof. I've always been interested in options thinking about how they behave and how to value them (and with the current financial crisis, have been taking more looks at bankruptcy).

First consider an oil company which can extract oil out of the ground for $70 per barrel with 1M barrels in the ground. The current cost of oil is $60. It costs more to get the oil out of the ground than it does to sell it on the open market, so the project is negative NPV right?

Well what happens if the oil prices rise to $80 a year from now? Then with a return of 10% (assume that it takes a year to get the oil out), you can make $10 per barrel on 1M barrels. The NPV works out to be about $9.1M.

But there is some inherent risk in this position which relies on the price of oil moving up. Sound familiar? It is the exact same behaviour as a call option.If the value of oil drops, the land is worth nothing, but if the value of oil appreciates, the value of oil appreciates accordingly also. The analogy holds up if you replace Exercise Price with Extraction Cost.

Here is another example of option like behaviour: Companies near bankruptcy.

Scenario 1: Healthy
Net Debt = $5M
Enterprise Value = 11M (Enterprise value calculated based on DCF)
Market Cap = 6M

Scenario 2: Near Bankruptcy / Highly leveraged:
Net Debt = 5M
EV = 6M
Market Cap =1M

Scenario 3: Bankruptcy
Net Debt = 5M
EV = 4M
Market Cap = 0

Because of the nature of capital at risk for corporations, the equity cannot fall below zero. A company in this position might also take on excessive risk (deliberately stir volatility on extremely risky projects) because there is nothing to lose.

However, in the absence of that, a company's equity at or near bankruptcy will be have much like a call option. Because of this relationship, a vulture fund might use the Black-Scholes model could potentially apply as an appropriate valuation metric to value the time value of the equity.

Thursday, December 3, 2009

Terminal Valuations - Theory and Practice

Yesterday, we had another Capital Markets Technical Prep session. We were looking at valuation methods including DCF, multiples, book value and precedent transactions.

In DCF, we talked about how to value a company's terminal value and discussed how in theory the values should be the same. This a concept I talked about at the Analyst Exchange when I was giving my lecture on geometric series (the math behind DCF's perpetuity formula). In the video, I briefly mentioned how our Hedge Fund Manager commented how it was a coincidence that the numbers were so similar. In theory, as our professor, Heather Ann Irwin mentioned, they should be the same and I just wanted to have a quick look at what the implication is.

There are two methods for valuing a companies terminal value are using a perpetuity method and EBITDA multiples.

The first method, the Terminal Value calculation using a perpetuity formula is: TV = FCF / (WACC - g).

The second method, the TV using EBITDA multiples is: TV = EBITDA x Multiple.

However, if in theory, they are supposed to be the same:

FCF / (WACC - g) = EBITDA x Multiple

I wanted to express the multiple in terms of the perpetuity formula so I rearranged the equation to get:

Multiple = (FCF/EBITDA) / (WACC - G)

This is exactly the point I was trying to make in my lecture in New York when I said that the two formulas and methods were related (except I forgot to highlight the "correction factor" between FCF and EBITDA which is essentially the same as a cash flow to operating profit margin - a factor which adjusts for the difference between FCF and EBITDA - just because EBITDA is often a proxy for FCF doesn't mean it's exact).

Another way of looking at this is as a mathematical proof for why comps valuation works. From an Integrative Thinking perspective, it is essentially looking at two different models for valuation which are looking at the same object and producing different results. Even though in theory both models look at the identical object, they will produce different values, yet I think this is a good integrative solution for understanding what is salient and causal in both models (and how they are related despite their differences).

In this way, if you could have perfect information, assuming that other analysts did comprehensive DCF, you could take a similar company and use the comps multiples to value that company.

Saturday, November 7, 2009

2x Gold Exposure Without Leverage?

Today was the first Rotman stock pitch competition where the second year students gave the first years a chance to practice their skills in valuing and pitching companies. It was an interesting experience for all of us and there were many lessons learned.

In talking to other people doing pitches for companies in different industries, there was a lot of learning between groups. I though I would write about some of the more interesting lessons.

This post is focused on gold (or mining exposure to raw materials). Gold and copper have very important attributes and characteristics which are highly correlated to the health and confidence of the economy, especially as it relates to Canada. As a result, most portfolios will have some exposure in these areas depending on the strategy. Gold is often used as a hedge against inflation, but copper is associated as a leading indicator for the health of the economy.

However, in order to make larger hedges in the market based on these commodities, portfolios will utilize instruments which promise 2x exposure to these materials. When I first heard this, I asked, "How is it possible to have 2x exposure without employing some form of leverage?"

As Shree explained to me, this is how it works:
Imagine gold is selling for $1000 per ounce.
Imagine a company can mine gold for $500 per ounce.
It's profit is $500 per ounce (and let's exclude all other costs for now, or assume that the $500 per ounce includes all expenses).

Now imagine gold rises in price to $1100 per ounce.
The company can still mine it for $500 per ounce.
The profit is now $600.

Gold has only gone up 10%, but the companies earnings have gone up 20%! It's a 2x exposure without any leverage.

Thursday, November 5, 2009

The Calculus of Duration

We have been discussing bonds and spot rates in finance as a fairly "simple" investment vehicle (no default risk for government bonds and steady and predictable cash flows).

While I had technically learned the math behind bond duration, it was after the homework assignment that we were assigned in finance that I began to get a better understanding of exactly what this means and why it's important.

As I had mentioned before, duration is defined as the percent change in price for a given change in yield. You'll notice that the definition of the formula is strikingly similar to elasticity calculations.

However, rather that jump in at that level, let's talk about it from the first principles of calculus:

P = C + C/(1+y) + C/(1+y)^2 + C/(1+y)^3 + ... + C/(1+y)^n + M/(1+y)^n

Where P is the price of the bond, C is the coupon and y is the YTM and M is the face value. So far nothing new. But the next idea is to take the derivative of the Price, P, with respect to y to understand how the price will be affected for any give change in y. We can re-write the formula as:

P = C + C (1+y)^-1 + C (1+y)^-2 + C (1+y)^-3 + ... + C (1+y)^-n + M (1+y)^-n

dP/dy = - C (1+y)^-2 + -2 C (1+y)^-3 + -3 C (1+y)^-4 + ... + -n C (1+y)^-(n+1) + -n M (1+y)^-(n+1)
= -1/(1+y)[ C (1+y)^-1 + -2 C (1+y)^-2 + -3 C (1+y)^-3 + ... + -n C (1+y)^-n + -n M (1+y)^-n

Recall that dP/dy describes the change in P with respect to y. In order to get percentage change, we divide both sides by P. This gives us the term dP/dy * 1/P which is a precursor to understanding % change in P or modified duration:

dP/dy * (1/P) = (1/P)[ -1/(1+y)][ C (1+y)^-1 + -2 C (1+y)^-2 + -3 C (1+y)^-3 + ... + -n C (1+y)^-n + -n M (1+y)^-n]

There is a special definition for the monstrous summation term above called the Macaulay duration which is defined as:

Macaulay duration = [ C (1+y)^-1 + -2 C (1+y)^-2 + -3 C (1+y)^-3 + ... + -n C (1+y)^-n + -n M (1+y)^-n] / P

Modified Duration = -Maccaulay duration / (1 + y)
= dP/dy * (1/P)

That's a lot of complicated math with calculus. What is the value of this exercise? Well if you can understand how your bond liabilities will move with interest rates, you can construct a portfolio of bonds which can insulate (immunize) you from changes in the price due to changes in the yield even if the bond's structure you are using to immunize is not of the same construction as the original liability buy matching face values and durations.

Therefore any change in the percentage value of your liability will be offset by a similar change in the percentage value of your bond portfolio (a hedging asset).

Monday, August 10, 2009

My Analyst Exchange Profile

This is a short video of me posted for the Analyst Exchange explaining what I think of the program and my experiences. There will be more profiles posted soon. Check the Analyst Exchange website for more videos and photos of speakers and participants.

Tuesday, August 4, 2009

Analyst Exchange - Lecture Video

This is a video uploaded on YouTube where I was showing my colleagues the underlying math behind a perpetuity, specifically as it relates to calculating terminal values using EBITDA.

Monday, July 27, 2009

Analyst Exchange Financial Modeling

For those of you who don't already know, I'm currently in NYC and have recently finished my financial modeling course with the Analyst Exchange.

While taking an Engineering and Management degree exposed me to all the core business courses (finance, accounting, marketing, HR etc) and the CFA focused even more so on finance, it was refreshing and confidence inspiring to be able to take a class where the principles we learn move us away from the strictly academic and theoretical into the real and practical.

I'd recommend this program to anyone who was interested in making active use of their finance knowledge and who wanted to have an edge making their entrance into the world of finance.

As I'm quite happy with my experience, I thought I'd pass it along for anyone else who was looking into similar training programs.

[DISCLAIMER] This advertisement was unsolicited and non-compensated.

Thursday, July 23, 2009

Chapters Indigo - Model with LBO Module

I've been learning a lot in my courses, but I haven't had a chance to post any good lessons lately because I've been so busy.

However, last night, I took some time off to complete a model using everything we've learned so far. Although the model isn't "complete" (synergies from the LBO are not currently included), this model includes projections, debt schedules, working capital schedules, depreciation schedules, and even a model for leveraged buyouts and valuation.

There are plenty of comments outlining major assumptions in how these numbers were derived. I would encourage you to play with the numbers to understand the relationships in the model work for valuation purposes.

[DISCLAIMER]
While the numbers look "good" (valuations are in the 20's and IDG:Indigo is trading at around $19) this information is provided without warranty as a strictly academic exercise only. Trading on this information is risky (beyond the standard business risk) as well as foolish and reckless.

I am not responsible for you using the model for the purposes of trading or other investment decisions. Consult a qualified financial adviser before making any investment decisions.

Chapters Model with LBO Module

Information for this model is based on the 2009 Chapters / Indigo Annual Report.

[Note] This spreadsheet contains circular references in order to calculate exact interest expense iteratively (using real cash gains from reduced interest expense to further reduce interest expense). Excel is usually configured to allow you to do this, however, you may have to change your settings to allow circular references.

Tuesday, July 21, 2009

Teaching at the Analyst Exchange

We were doing our training earlier last week when we approached terminal values. Although we were shown the formula, I mentioned that I could prove how the formula was derived from first principles (as well as outline the fundamental assumptions for when this formula works ... and falls apart). It's a very elegant solution that explains terminal value as well as enterprise value multiples.

The math used was based on my post about geometric sequences and series and extended to encompass finance discounted cash flows.

I'm requesting a copy of the video so I can post it on Youtube and this blog. Please excuse my attire. It was casual Friday.

Monday, July 13, 2009

The Wall Street MBA, by Reuben Advani

As part of the training program, we've been given a copy of Reuben Advani's The Wall Street MBA. It's a really good primer for material in the MBA and good casual reading for people who want to stay a bit sharper on the subway.

Advani uses colorful examples from current events to describe accounting and corporate finance concepts, including a chapter dedicated to fraud and manipulation (some topics of which are covered in this blog including profit smoothing).

More advanced readers would probably still benefit from the second half of the book, covering more complicated topics such as derivatives, arbitrage, hedge funds and M&A.

While Advani's book covers a broad and comprehensive range of topics, it's depth is good enough to get a feel without feeling overwhelmed (although some topics like inventory control, LIFO, FIFO etc could use a bit more 'time').

Tuesday, April 21, 2009

Vulture Funds and Angel Investors... Similarities?

Looking into the mirror to see your true reflection. I've been watching the news lately about the bad rep that short sellers have been getting in the market. They are perceived as being ruthless profiteers who will cut throats in order to make a buck. While there is a lot of justification for this view by the media, I would like to make the case for efficient markets and perhaps putting short sellers and other seemingly "evil" profiteers (such as vulture funds) in a unique light.

The first complaint about our market crash was that we should have seen it coming. PE ratios were high, LBOs were progressively looking less attractive (but still being done). All the signs were pointing to the market being generally overbought (too much money chasing too few investment opportunities). While most people agree that bubbles were forming, no one was willing to really do anything about it. Except, that is, the short sellers.

Short sellers are blamed with the precipitous decline of the market. By betting against the highly valued stocks, they are blamed with triggering the stop loss sales of equity associated with the rapid decline in price. Although I don't doubt short selling triggered the decline, I would also emphasize that they put themselves in a position of great risk. After all, no position in the stock market comes free, and a short position is decidedly not "group think" in the stock market, the giant positive reinforcement machine as described by Jim Chanos in Hedge Hunters. It is notable Chanos' short biased firm was among those asking the right questions which highlighted the accounting irregularities (and eventual fraud) at Enron. However, the real cause of the precipitous decline in equity prices is the automated stop loss sales.

Stop loss sales are limit orders placed on stocks by traders who essentially say this: "If the stock drops below a certain price, I want to sell of my position to prevent further losses". If I own 100 shares at $20, I want to sell it if it goes to $10 to recover $1,000, rather than lose all of it if it drops to $0. It is an automated stop gap measure to prevent total loss. However, look at the underlying logic: "I understand that there is a possibility that what I'm holding isn't worth even $10."

While incredibly oversimplified, this fundamental doubt acknowledges the distinct possibility that the stock is overvalued.

For those who said that the stock market was overvalued in 2007 / 2008 and that this crash is a "reckoning of careless and risky capitalist pursue of profits", the correction of such an oversight would be to bet against the market (ironically, also framed as a "risky capitalist pursuit of profits" but in the opposite direction).

I don't feel it is entirely fair for those who complain about the market being over valued to also complain about those who agree and are willing to put their money where their mouths are (by positioning themselves in a risky position against the consensus of everlasting growth).

Having said that, is it entirely fair that some companies crashed, reaching a point where they are utterly distressed? Again, in an efficient market, I would say yes and no. A company that has crashed beyond it's intrinsic value immediately becomes a target for a vulture fund. If it's equity is depressed because of overselling by emotionally panicked investors, I think this is a golden opportunity for vulture funds to step in and pick up cheap investments with the intent of saving the company.

The risk profiles of vulture funds and angel investors (venture capital) is surprisingly similar (except that I would assume vultures to be assuming more risk... The momentum is in the wrong direction). I would even go so far as to say that vulture funds are the last chance before the capitalism hell of bankruptcy (as Elizabeth Warren describes on the Daily Show: "Capitalism without bankruptcy is like Christianity without hell"). Metaphysically, I suppose a logical question to this analogy is are you selling your soul to the devil or seeking divine redemption as your escape?

This means that if a company is worth saving, even malicious intent by unscrupulous traders should be offset by intelligent analysts who can see value and pick up depressed stock prices (to the loss and chagrin of the "evil" short sellers). This is directly similar to my previous post about the mechanics of sales and trading. In an efficient market, even those who want to cheat should (and would likely) get burned.

In an ideal scenario, if companies became TOO distressed and all their financial vehicles (bonds, mezz, equity) became overly depressed, if the company could still be saved (good fundamental business model), this is a textbook example of how investors could come in, acquire a controlling share of the company and turn it around.

Yes, concessions and covenants have to be made, but without the assistance of vulture funds providing additional financing, the companies are about to go bankrupt anyways. The mechanics of short selling and vulture funds are simply investment and trading mechanisms, and like any technology can be used for "good" or "evil". However, I think it would be a error to generalize and mistake the white knight for the dragon.
Sunday, April 19, 2009

Simulated Reverse Dilution

We are all aware of dilution of EPS in common shares by the conversion of preferred shares to common and I've previously written about what affects the dilution decision for those holding convertible options. However, although this is a one way conversion, is it possible to simulate the reverse in a virtual reverse conversion?

While I suggest one possible alternative and it's reasoning, I think it becomes quite obvious why this doesn't happen (at least not directly).

First of all, a dilution conversion is taken in the circumstance when a company seems to be about to reach a tipping point of success as those holding the convertible options of preferred shares decide to convert to common shares. Until these conversion options expire, holders of the preferred shares would probably prefer to take their dividends (cash in pocket) until the last minute, maximizing the value of their options and reducing the risk of the company crashing in the interim. When the decision for the dilution decision is reached (depending on a variety of criteria) it is essentially based on the maturity and stability of the company.

This means that to take the reverse action is to bet against the maturity of the company. In the reverse analysis of the decision criteria, it assumes that EPS is weaker than dividends. In the scenario of an established company, this comes as a major red flag that the company is in distress if it is struggling to generate the necessary revenue to sustain it's cash payment obligations.

To simulate the reverse of a conversion, this would essentially mean shorting the common equity position and picking up preferred shares. However, assuming all preferred shares are converted and unless more preferred shares are issued, this is incredibly difficult (because there is nothing to buy to simulate the reverse conversion). Usually, the only comparable option is to pick up debt (short equity and go long on the companies bonds - a similar concept to the flight of quality).

However, if you are looking and manuevering solely in one company (rather than the entire market) and your only move is to reallocate your assets from equity to debt holdings, you are essentially burning down the house to get the insurance money. The corellation between these two assets (despite being in different asset classes) is extremely high. After all, a company experiencing distress won't only feel it in it's equity prices but probably also in it's solvency ratios (possibly reflecting a downgrade in it's credit rating).

As is unfortunately common practice in todays market, companies in distress are experiencing financial difficulties in both its debt ratings and equity value meaning that it will struggle to raise additional financing.

Vulture funds who see this coming will dump financial support of companies (perhaps even shorting them) in the hopes of picking up distressed funds for pennies on the dollar and looking for upside on the turn around and restructuring of the company. Obviously, this is incredibly risky as even distressed assets are cheap for a reason. Financial gravity is such that recoveries in such scenarios are often unlikely.

Although similar to deleveraging in many respects, focusing on distressed companies is different in that in the toughest times, everyone gets a "hair cut". Except for bankrupcy liquidation (Chapter 7) where senior debt has priority claim (and which is rarely used seeing as companies generally hate admitting defeat), restructuring (Chapter 11) is such that everyone who owns a stake, bond holders, mezzanine financing and even equity holders make concessions. Usually, this comes in the form of bond holders and mezz financing to take reduced claims while equity holders and other stakeholders (employees) make covenents (reduced wages, selling off non-performing divisions etc).

Thursday, April 9, 2009

Katherine Burton's Hedge Hunters

Certainly an interesting book, Burton investigates "the Rewards, the Risk, and the Reckoning" from the perspective of the top hedge fund managers in the industry.

Through her extensive interviews with these managers, she uncovers their attitudes as well as their advice and recipes for success:
  • Financial stamina and conviction to hold positions against the market (short sellers)
  • Doing your homework (and more homework if you are in doubt)
  • Unrolling losing positions faster (admitting you are wrong)
  • Decision making ability is the characteristic quality between making the jump from analyst to portfolio manager
  • Just because they make it look easy doesn't mean it is. Many managers derive their skills from a broad range of backgrounds, but the common trend is they used their knowledge and skills to better arbitrage risk that others don't understand

Sent from my BlackBerry device on the Rogers Wireless Network