Monday, April 25, 2011
The End
Thursday, April 21, 2011
Service Management Field Trip – Thessaloniki
This has been a unique experience, to hear from the mouths of people who live here their opinion on a very timely topic: globalization, competitiveness and the structure of a nation’s (Greece’s) economy. Our professors did a lecture on Monday talking about the characteristics of the Greek economy, breaking down GDP components and telling a story about Greece’s economic focus and structure over the past 5 years as a backdrop for the current conditions the country is facing. They also prescribed a logical recipe for what would be needed to turn the Greek economy around and the challenges involved. These sentiments were echoed by many of the project sponsors who participated as many of them were looking to boost their competitiveness and engage the other economies of the world.
Today, I’ll be spending most of my time wrapping up all remaining loose academic ends in the hope of leaving nothing unfinished for my return to Toronto.
Sunday, April 17, 2011
Back in Thessaloniki
We have our first official class today. We've already been in contact with our sponsor company and also have our first group meeting today as well as we meet face to face for the first time.
Tomorrow, we have an arranged city tour which I am looking forward to. Also, today is Palm Sunday, which marks the beginning of Holy Week in Greece which is a very important holiday with unique celebrations that I am looking forward to.
I am also in the process of completing my final project for Managing Corporate Turnarounds as my other team members have sent me their parts and I finish up the write up for our class.
After my class is done here on April 21st, there are a few days to spend before flying back to London on the 24th. My flight back to Toronto is the 26th. While I have really enjoyed my time here, I’m looking forward to going home, visiting my sister in New Orleans on the 27th (to drive back to Toronto).
I’ll be spending May studying for the CFA II exam after which I’ll also have the opportunity to visit friends and family in Australia in June and Malaysia (with a chance to climb Mt. Kinabalu and dive in Sipadan hopefully) in July before I return to Scotia Capital in August.
Saturday, April 2, 2011
Cheerio!
So I apologize in advance if there are few posts between now and then. But who knows? In the country that spawned famous philosophers and mathematicians, maybe there will be some inspiration. Plus, I still have a few small assignments to complete for MCT.
Being Made Whole in Bankruptcy
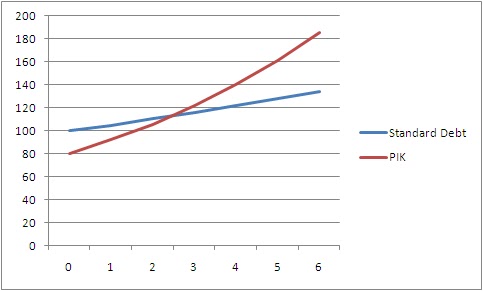
FV x (1 + kd) ^ N = FV x (1 – X) x (1 + kd + Y) ^ N
However, this assumes that you can break even with (or more accurately, catch up to) where your security would have been if the company had not defaulted to begin with. After playing with these numbers, however, it was quite clear that even with a small discount (say 20% discount), the spread Y had to be astronomically (unreasonably) higher in order to have any chance of being made whole relative to the standard debt, so I thought it would be unrealistic not to include a factor which accounts for the value lost:
FV x (1 + kd) ^ N = FV x (1 – X) x (1 + kd + Y) ^ N + Value Lost
In trying to understand what these numbers mean, I looked at Value Lost / FV as a proxy for the default rate of this type of security in distress which is obviously closely tied to the actual economic circumstances of the company. In the graph, it is reflected by the distance between the Standard Debt curve and the PIK (Realistic) curve.
Also, Y can probably be determined by looking at the spread between similar bonds with different credit ratings (dropping from BBB to C for instance).
X is reflective of the economic scenario (so if EV was 80 and Net Debt was 100, X would be 20%). It is also reflective of the negotiations, as well as considering a discount in order to liquidate the current assets of the company.
Another problem is also that once a company switches from PIK to cash sweep, its risk profile drops and it stops earning high yields, dropping the return on capital and therefore making it impossible to “catch up”. Also, a bank which was happy to finance your debt will not be interested in converting neither into a mezzanine structure better suited for hedge funds nor into equity.
This model is similar to the VC model of predicting the failure rate using the discount rate except in reverse. It is also similar to the interest rate parity (IRP) model and boot strapping by using compounding to determine where you would have / should have been otherwise as a benchmark for where you are going.
I guess the real lesson is that bankruptcy is really expensive and that being made whole in this scenario is difficult, regardless of the financial engineering and patience, although these two factors can be used to ease the pain.
Thursday, March 31, 2011
Managing Corporate Turnarounds - Part II
Often when things go wrong, people are inclined to fire the management. However, in the real world, things are hardly ever that simple. Firing management, like anything in turnarounds, is decided on whether or not this action will speed up or slow down the turnaround. Besides packages given to executives on exit, there is also a great deal of institutional knowledge that they take with them. There is a counter balance to understanding the value they bring through their experience versus the inertia they create against the changes required. This is particularly true in SMEs as well as family owned enterprises where the institutional knowledge is often not formalized (pricing mechanics, customer relationships etc.)
Also, with the separation of the chairman and CEO roles, it is possible that a power divide coupled with an inappropriate strategy may have smart people being told to chase bad strategies. One remedy which is often used is an immunity period: the idea that employees in a turnaround situation have a window of opportunity to identify any potential problems. This allows an honest analysis of problems without reprimand and realigns expectations (Are we going to make the numbers? Are our margins as good as we expect? Are we doing things right? Are we doing the right things?) Because a new team is put into place to fix previously created problems, it is not appropriate to assign current problems to new management. However, eventually, whether or not these issues were created by you initially you will inevitably begin to wear them if you don’t fix them soon enough or don’t manage expectations of the company and all stakeholders.
Thursday
Like in any business strategy, there are two major things to keep in mind in a restructuring: operations and financing. For operations, it is necessary to check if the overall business strategy works (are people buying your product and do you have a viable business) and if you are able to profitably deliver (are our margins good or are we chasing low quality customers). Also from a financing perspective, it is important to understand the liquidity constraints of the enterprise. For example, what is an appropriate financing structure to keep the company alive while providing adequate and appropriate protection and returns to current and new capital providers?
One such useful tool is the paid-in-kind (PIK) security. It is a type of mezzanine high yield debt that doesn’t pay a coupon. Typically, these types of securities return 14 to 17%. They return higher than senior debt because they are subordinated but they don’t require cash payments which allow the company to maintain its liquidity for short period of time when it’s heavily cash strapped. However, what usually happens is this is coupled with a cash sweep. To use a structure like this in this circumstance is tantamount to saying: “We understand you are strapped for cash now, so you don’t have to pay us immediately, but we want an appropriate return for taking this risk that’s more similar to equity if things recover. However, we still want to be paid sooner rather than later and when you have any excess cash, you will give us everything you have and we’ll consider you less risky and ratchet down your interest rate to reflect the change in risk.”
Tuesday, March 29, 2011
Artistry with Dr. Hilary Austen
Managing Corporate Turnarounds
Thursday, March 24, 2011
Travelling in Europe
So far this week, I’ve been to Madrid, Spain and Bordeaux, France. I'm travelling with a few students from LBS and we are driving down the coast of the south of France and into northern Spain, visiting coastal towns as we make our way down and are currently San Sebastian, Spain. My French has been a bit rusty, but enough to decipher menus, make orders, ask directions and generally get around. It has been almost 5 years since my CFES days.
(Shown above: Chateau Margaux, Bordeaux, France)
(Shown below: San Sebastian, Spain)
Having visited Lisbon, Portugal and Rome, Italy there is only one other country I need to visit to collect my PIGS set: I plan on visiting Greece in early April for my final block week course: Service Management Field trip, a consulting project based in Thessaloniki, Greece.
I have always enjoyed Greek mythology, especially after reading the Odyssey in high school which was one of my favourite books of all time. I will certainly enjoy spending time in Athens visiting some of the ancient ruins. Greece is also home to many famous mathematicians and philosophers that derived such elegant concepts such as the approximation of pi or the golden ratio. I'm really looking forward to the trip.
Tuesday, March 15, 2011
Emerging Markets - China
Tim did a great job going into the details of the domestic business environment with some personal anecdotes from some of our team members’ recent trip to China. JEMBAs (aka January intake Executive MBAs) at LBS are required to a week intensive in a foreign country and three of our JEMBA team members visited China together.
I think we represented the hard work and analysis of our team well.
Monday, March 14, 2011
Planned Obsolescence
I've also got a final PEVC assignment due in-class tomorrow where our take home individual case will also be released. Also, tomorrow, I have a big presentation for Emerging Markets with the final group and individual papers due by the 18th.
What a roller coaster it's been, not just here but in the MBA program in general. It seems like not too long ago, I was stepping into Rotman for the first time. After taking a look back at this blog, I've realized how much I've enjoyed my time at Rotman. And with the end of the program so near, it's time to plan wrapping up of all the loose ends.
I have two more classes left, block week courses (one week intensives) which I'll be taking between now and the end of April. However, this provides me with ample opportunity to take advantage of the easy access to Europe and as such I'm planning trips with some of the fellow exchange students between now and when I leave. My last two classes are Managing Corporate Turnarounds (last week of March) and Service Management Field trip, a consulting project where our class will be in Greece (jokingly referred to as "exchange on exchange") which will be my final class of the MBA program.
I'll continue to blog as interesting ideas pop up in the last few classes and probably put up a few nice pictures from my travels, but I expect that I'll put up a final post around the end of April as I head back to Toronto.
Wednesday, March 9, 2011
FEI Competition
http://www.feicanada.org/cfo-tv.php?vid=22&page=2
Enjoy!
KKR at LBS - Socially Responsible Private Equity
Just now, we had the inaugural talk for the Socially Responsible Private Equity talk given by Ken Mehlman, KKR's Global Head of Public Affairs. He was the Chairman of the United States Republican Party, campaign manager for President George W. Bush's re-election campaign, and White House Political Director. He was also a classmate of Barack Obama at Harvard Law.
He gave a great talk on how social responsibility is integral to sustainability of a business, especially one with patient capital in PE. One point he made which I thought was particularly poignant seemed to echo the ideas of Integrative Thinking. He said that there are generally two common models with regards to social responsibility:
- Corporate CSR – Where a company makes contributions to organizations outside of its operations that show it cares.
- It focuses solely on strong operations and generating business returns to the bottom line without much consideration for social responsibility.
Besides some of the insightful deal war stories, future PE trends and industry knowledge he shared, he also gave great advice on what he thought it took to be successful which was well received by the crowd.
There were a host of excellent questions asked by the crowd in the Q&A session as well as the cocktail reception following. I’m looking forward to the next event hosted by the PEVC club.
Thursday, February 10, 2011
Bid / Ask Curves
In microeconomics, we discuss demand curves and how they are based on individuals with different levels of willingness to pay. So as the price increases due to a supply curve shift right (less supply), the quantity demanded decreases.
In markets, this is a little more transparent if you look at the bid / ask lists. These lists show the prices and volumes people are willing to buy and sell for. The other unique thing about the capital markets, is that there is actually a set number of securities (assuming that banks do not issue or buyback securities in the short term, supply is price inelastic based on total float) and that investors can be both buyers and sellers (short term suppliers and consumers) of securities. Actually, a better way to put it would be they can either hold or release securities (demand based relationship).
If their intrinsic value (IV) of a stock is above the current market price, they will buy the stock. If their IV is less than market, then they will sell. And in an exchange market, that is exactly the case (orders, unless removed before execution, are commitments to buy or sell at the stated price).
Shown here is an illustration of a “complete” market. This assumes that everyone’s IVs are included, that there are no hidden orders and that people’s opinions won’t change with the market price (a snapshot by nature). The current ask price is $8.00 and the bid is $7.75. As people’s sentiments change (or new investors are introduced into the market), orders to buy are satisfied at $8.00 and orders to sell are satisfied at $7.75. If all the potential sellers at $8.00 are taken up, then people can only buy the stock at $8.25 and the stock price goes up. Note that the differential between bid and ask is a proxy for market liquidity, as the lower the transaction fee to enter and exit a position the lower the cost of trading the security.
Also note that the steepness of the curve is a good proxy for potential volatility as well. Because if the slope of the curve is steep over a variety of prices, it means that the market doesn’t necessarily agree on the price. And if a few people cross the line from one side to another, the price can change quickly and dramatically (shown below):
Tuesday, February 8, 2011
Bridge to Value
Previously, I mentioned a framework for PE deal success, but it is easy to cut into more detail if necessary and really define and put a mathematical value to "synergies".
For example: After a transaction, we've increased sales by 21%. How does that affect EV? Well on one hand, you've immediately realized a 21% increase in revenue. After you account for associated costs with that increase in revenue (ie. You've sold more widgets, but it still costs you money to make those widgets), what do your future growth prospects look like as a result of this new growth (ie. Should you trade at a higher multiple? Have you gone from "boring" to "exciting"? Or is it just general market conditions?)
Previously, you had:
Market Cap = $100
Shares outstanding = 100
Price per share = $1
Debt = $100 (@ 5%)
Excess Cash = 0
EV = $200
Revenue - $100
COGS - $40
GPM = $60
Op Ex - $20
EBITDA = $40
DA - $10
EBIT = $30
Interest = $5
Tax = 40%
NOPAT = $18
NI = $15
Therefore:
EPS = 15 cents
P/E = ($1/$0.15) = 6.67x
EV/EBITDA = ($200/$40) = 5.00x
Let's tell a story: The 21% increase comes from opening a new line of products. You are selling 10% more products by introducing a new product line and this new product line actually increases your revenue per unit (across the board) by 10% (110% x 110% = 121%). All margins are the same.
What should we do? Bring everything down to the EBITDA level:
Now:
Revenue - $121
COGS - $44 (10% more products at same costs)
GPM = $77
Op Ex - $22
EBITDA = $55
DA - $10
EBIT = $47
Interest = $5
Tax = 40%
NOPAT = $28.20
NI = $25.20
EPS = 25.20c
(Magic happens - Which we will explain shortly)
New Price per share = $1.80
Market Cap = $1.80 x 100 shares = $180
Debt = $100
EV = $280
P/E = ($1.80) / ($0.2520) = 7.14x
EV/EBITDA = ($280 / $55) = 5.09x
Analysis:
So a lot is going on. The price of the equity and the enterprise has changed, but how can we do a cross section such that we know exactly where all the value is being driven from?
How much of this value is because of leverage (hint, we didn't change amount of leverage)?
How much of this value is simply because we are operationally better?
How much of this value is because we have a "brighter future" (better growth prospects)?
Step 1: Value from leverage arbitrage:
No change = 0
Step 2: Value from "synergies":
Total EBITDA level changes: $40 to $55 or $15
At a multiple of 5.00x (previous multiple), value increased is $75
Step 3: Value from "Brighter future"
Brighter future (higher multiple) due to either market conditions or expected future growth:
$55 at 5.00x versus at 5.09x = $55 x (5.09 - 5.00x) = $5
Total value created: $75 + $5 = $80 (note total increase in value of EV / Market Cap)
Next step, look closer at Step 2:
Change of $40 to $55 is created by:
$21 in Revenue (Price +10%, Volume +10%)
$4 in COGS (Volume + 10%)
$2 in Opex (Volume +10%)
For a $21 increase in revenue, keeping margins constant we would have expected an increase of:
$8.4 in COGS (40% of revenue) and $4.2 in Opex (20% of revenue). COGS is lower by $4.4 and Opex is lower by $2.2 versus what is expected.
Note we mentioned we can sell products for 10% more across the board.
This created value for existing product base (at EBITDA level) of
$110 - $40 - $20 or $50 versus $40 creating $10 of additional EBITDA level value (makes sense, increase topline growth by 10% without changing expenses / sales volumes results in increase of EBITDA by 10% of revenue)
Also, selling an additional 10% at old price we would expect:
$10 (additional sales) - COGS ($4) - Opex ($2) or $4
But selling new products at new price: Gain $1 (similar to math shown above)
Total change in EBITDA: $10 + $4 + $1 = $15
At 5.00x
$55 or ($10 + $1) x 5.00x of EV is generated from selling at a higher price
$20 ($4 x 5.00x) of EV is generated from selling new products (higher volume)
Note, this framework is iterative and can be applied across multiple product lines to help do a break out and sum of the parts analysis for companies to see where value is hidden in undervalued divisions.
Also note that as an interesting aside, if you were actually to build out a proper DCF model of this (using some basic business assumptions holding margins constant etc.), your short term growth rate would have to be adjusted upwards in order to come to the same intrinsic valuation that would justify the higher multiple.
Flight of Fancy - Market Price for Courses
Obviously, one of the benefits of going on exchange is to meet new people and learn from new experiences. Previously, I had posted on a flight of fancy, where I wondered what would happen if we extended the idea of our bidding system at Rotman to the “next level”. Well it turns out that elective bidding at some other schools can be slightly more complicated.
Talking to some students at other MBA schools, they have more “progressive” (market driven, while not entirely "pure") bidding systems for courses, where you can actually buy and sell courses for a profit (expressed as a gain in “points”) where you bid for classes early and then “sell” them at a later date when their point value has increased.
The only short coming of their system (from a market perspective) is that there is only one form of “liquidity”. The only way to truly “exit” the market? Take a course. There is no other way to liquidate these points. This could easily be solved if you could simply transfer the points to another student (a secondary market would develop and even create an OTC market price in $$$'s for course points).
And then you would have a market answer for the question: “How much is the margin worth to take the elective course you want?”
Friday, February 4, 2011
Chinese New Year in London
Earlier this week, a few of the exchange students at LBS went to celebrate Chinese New Year in typical fashion, over a splendid meal, in London’s “alternative” Chinatown near Queensway. While the lineup was fairly long (we ended up waiting for 45 minutes due to exceptionally high traffic volume), the service was otherwise very good and the meal was delicious.

Earlier that week, I was also lucky enough to catch a dragon dance show in London’s official Chinatown near Piccadilly Circus while buying some groceries.
Tuesday, February 1, 2011
The Globe and Mail featuring Rotman Students
Being from Venezuela, Alejandro gave helpful comments on a case we had studied in our Managing People in Organization class way back in Q1 of first year when we looked at a Canadian bank acquiring a bank in Latin America and the merger of cultures. He certainly added some meaningful context to our discussion as someone who was born and raised in that part of the world.
You can listen to him speak on the Globe and Mail website on the experience of international students in Canada.
Some of my other classmates from Rotman featured include:
Ajay Jayarajan
Khaled Nounou (The same Khaled who was on the Islamic Finance ICP team)
Recently, I asked my classmates for guest posts about their unique experiences at Rotman and posted the series.
Sunday, January 30, 2011
Islamic Finance – Executive 3 Day Program
With the rise of Islamic finance, I’ve had some interesting conversations with people I’ve met while on exchange at LBS regarding Sharia compliant financial structures such as the various types of sukuks we’ve been analyzing.
Our spread analysis drove quite a bit of interest for people who were interested in what a Sharia compliant structure would yield and the market conditions for doing such an issuance. Even before our presentation, I had the opportunity to answer some basic questions regarding the pricing spread between Islamic instruments versus conventional.
Friday, January 21, 2011
Intuitive Explanation of Bayes’ Rule
But like any formula, if not understood at an intuitive level (aka memorizing the formula vs rebuilding it from scratch), applying the formula incorrectly will yield meaningless (and potentially misleading) results.
Bayes’ rule states:
P(A\B) = P(B\A) x P(A) / P(B)
On the surface, this formula seems to make no sense: “The probability of A given B is the probability of B given A multiplied by probability of A divided by probability of B.”
However, walking through step by step we first understand that:
P(A\B) = P(A Λ B) / P(B)
This makes sense. The probability of A happening given that B has happened is the area encompassed by A and B (gray) divided by the total universe of probabilities, B (red and gray), because we are told that B “has happened”.
So from here we can also understand that:
P(B\A) = P(A Λ B) / P(A)
Which is simply the same rationale as the one above. However, using algebra, we can see that:
P(A Λ B) = P(B\A) x P(A)
And combining the two formulas, we get the original:
P(A\B) = P(B\A) x P(A) / P(B)
Example provided in class:
Of patients entering a chest clinic:
Event A – Person has cancer
Event B – Person is a smoker
80% of people with cancer are smokers: P(A\B) = 80%
10% of patients have cancer: P(A) = 10%
50% of patients smoke: P(B) = 50%
If you knew someone was a smoker, what is the probability they have cancer?
Solution:
Most people would over estimate the number, due to various incongruities in the probabilities, namely because such a high percentage of patients with cancer are smokers at 80%.
However, the math shows us that P(B\A), the probability of finding cancer given that you know someone is a smoker is (80% x 10%)/50% or 16%. Although it is higher than the average of 10%, is still relatively unlikely that they have cancer relative to what most guesses anticipated.
You'll notice that the answer is heavily affected by the rarity (and relative elasticity) of event A, or the chance that someone has cancer to begin with.